
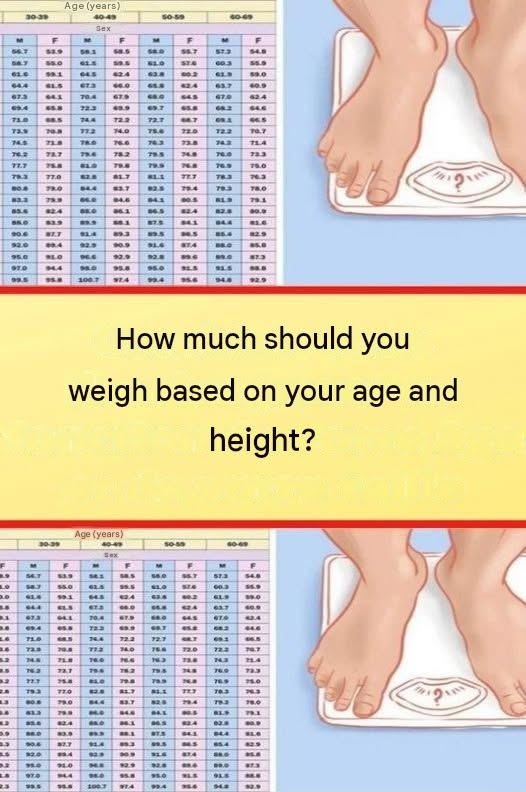
Determining an ideal body weight is a common health goal, with viral social media infographics regularly asking: “How much should you weigh based on your age and height?”
While traditional height and weight charts provide general reference ranges, modern medical guidelines emphasize individual body composition, muscle mass, and overall metabolic health over a single number on the scale.
Visual Breakdown: Weight Chart Infographic
The image presents a reference chart paired with an illustration of bare feet standing on a bathroom scale.
+-----------------------------------------------------------------------+
|                     WEIGHT CHART VISUAL ANALYSIS                      |
|                                                                       |
|   [ Height & Age Table ] ---> Columns for Age (30-39, 40-49, etc.)   |
|                                         |                             |
|                                         v                             |
|   [ Sex Category ]       ---> Male (M) and Female (F) reference values|
|                                         |                             |
|                                         v                             |
|   [ Scale Illustration ] ---> Feet standing on scale with question    |
|                               mark regarding target weight            |
+-----------------------------------------------------------------------+
Key Visual Components
- Structured Data Grid: Features age brackets across top headers (30–39, 40–49, 50–59, 60–69) separated by sex (Male/Female).
- Numerical Metrics: Displays target weight ranges (typically in kilograms) mapped to incremental height steps.
- Graphic Focus: A person stepping onto a scale marked with a question mark, symbolizing weight management uncertainty.
Key Factors Influencing Ideal Body Weight
- Body Mass Index (BMI): A standard screening tool that calculates the ratio between height and weight to categorize individuals into underweight, normal weight, overweight, or obese ranges.
- Muscle vs. Fat Ratio: Muscle tissue is denser than fat tissue. Two people with identical heights and weights can have drastically different body compositions and health profiles.
- Age and Bone Density: Natural changes in metabolism, muscle distribution, and bone density occur as people age, adjusting realistic weight management targets.
- Fat Distribution: Where the body stores fat (e.g., visceral abdominal fat vs. subcutaneous fat) plays a more crucial role in cardiovascular health than overall weight alone.
Standard Adult BMI Categories Overview
| BMI Category | BMI Range | Health Assessment |
| Underweight | Below 18.5 | Below standard recommended body mass |
| Normal / Healthy Weight | 18.5 – 24.9 | Optimal balance associated with lower health risks |
| Overweight | 25.0 – 29.9 | Elevated weight relative to height |
| Obesity | 30.0 or Higher | Significantly increased risk for metabolic conditions |
Frequently Asked Questions (FAQ)
1. Is BMI an accurate measurement for everyone?
BMI is a broad population indicator rather than a perfect individual diagnostic tool. Athletes with high muscle mass may be classified as “overweight” by BMI charts despite having very low body fat.
2. What is the healthiest way to determine your ideal weight?
Consult a physician or registered dietitian who can assess overall health markers, including waist-to-hip ratio, body composition analysis, blood pressure, and blood lipid profiles.
Conclusion
Height and age charts offer a helpful starting point, but focusing on sustainable lifestyle habits and muscle health provides a clearer path to long-term wellness.
